Heat Map Rendering Example
Copyright (c) 2014-2020 National Technology and Engineering Solutions of Sandia, LLC. Under the terms of Contract DE-NA0003525 with National Technology and Engineering Solutions of Sandia, LLC, the U.S. Government retains certain rights in this software.
Redistribution and use in source and binary forms, with or without modification, are permitted provided that the following conditions are met:
1. Redistributions of source code must retain the above copyright notice, this list of conditions and the following disclaimer.
2. Redistributions in binary form must reproduce the above copyright notice, this list of conditions and the following disclaimer in the documentation and/or other materials provided with the distribution.
THIS SOFTWARE IS PROVIDED BY THE COPYRIGHT HOLDERS AND CONTRIBUTORS “AS IS” AND ANY EXPRESS OR IMPLIED WARRANTIES, INCLUDING, BUT NOT LIMITED TO, THE IMPLIED WARRANTIES OF MERCHANTABILITY AND FITNESS FOR A PARTICULAR PURPOSE ARE DISCLAIMED. IN NO EVENT SHALL THE COPYRIGHT HOLDER OR CONTRIBUTORS BE LIABLE FOR ANY DIRECT, INDIRECT, INCIDENTAL, SPECIAL, EXEMPLARY, OR CONSEQUENTIAL DAMAGES (INCLUDING, BUT NOT LIMITED TO, PROCUREMENT OF SUBSTITUTE GOODS OR SERVICES; LOSS OF USE, DATA, OR PROFITS; OR BUSINESS INTERRUPTION) HOWEVER CAUSED AND ON ANY THEORY OF LIABILITY, WHETHER IN CONTRACT, STRICT LIABILITY, OR TORT (INCLUDING NEGLIGENCE OR OTHERWISE) ARISING IN ANY WAY OUT OF THE USE OF THIS SOFTWARE, EVEN IF ADVISED OF THE POSSIBILITY OF SUCH DAMAGE.
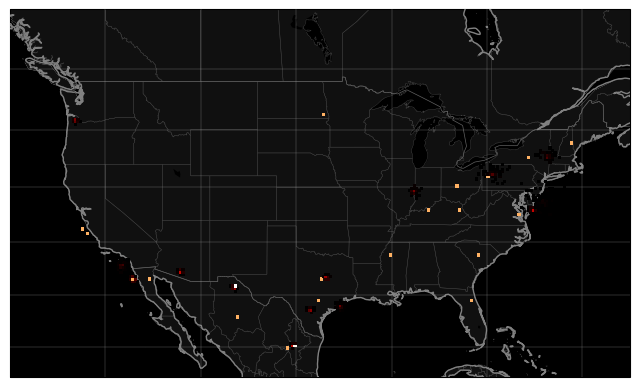
Purpose: Sample code to render heatmap of points
Imports
[1]:
from tracktable.domain.terrestrial import TrajectoryPointReader
from tracktable.render import mapmaker
from tracktable.render.histogram2d import render_histogram
from tracktable.render import maps
from tracktable.core import data_directory

from matplotlib import pyplot

import os.path
First we set up our point source by reading points from a file. Then we dump the points to a list. We do not care about extra data in this example, so we leave all the column fields as default.
The data file we use here is bundled with Tracktable.
[2]:
points = []
data_filename = os.path.join(data_directory(), 'SampleHeatmapPoints.csv')
with open(data_filename, 'r') as inFile:
    reader = TrajectoryPointReader()
    reader.input = inFile
    reader.comment_character = '#'
    reader.field_delimiter = ','
    for point in reader:
        points.append(point)
[3]:
# JUPYTER NOTE: Jupyter will show you the state of the figure when you exit
# the cell in which you created it.  You cannot apply different effects in
# different cells as far as I know.  To work around this, just put all your
# different things in functions, then call those functions one after another
# in a single cell.

# Set up the canvas and map projection
# Grab default bounding box
def get_bbox(area, domain):
    coords = []
    location = maps.CONVENIENCE_MAPS[area]
    coords.append(location['min_corner'][0])
    coords.append(location['min_corner'][1])
    coords.append(location['max_corner'][0])
    coords.append(location['max_corner'][1])
    return mapmaker._make_bounding_box(coords, domain)

# 100 DPI * (8, 6) gives an 800x600-pixel image
figure = pyplot.figure(dpi=100, figsize=(8, 6))
(mymap, map_actors) = mapmaker.mapmaker(domain='terrestrial',
                                        map_name='region:conus')
bbox = get_bbox('conus', 'terrestrial')
render_histogram(map_projection=mymap,
                 point_source=points,       # Our list of points we created above
                 bounding_box = bbox,       # Bounding box is generated from mymap
                 bin_size=0.25,
                colormap='gist_heat')
[3]:
[<matplotlib.collections.QuadMesh at 0x7fb9b52f8e50>]