Tutorial 5-E: Airport & Port Visualization
Purpose
This notebook demonstrates how to use Tracktable’s airport and port databases to populate a map. Tracktable has numerous rendering methods, and not all are shown here. A comprehensive rendering user guide can be found in the Tracktable documentation: https://tracktable.readthedocs.io/en/latest/user_guides/python/rendering.html
IMPORTANT: When rendering trajectories interactively, the memory required to render large lists of trajectories may cause your browser to shut down. Try rendering smaller datasets first and work up from there to test your browser’s capacity.
In [1]:
import tracktable.examples.tutorials.tutorial_helper as tutorial
from tracktable.render.render_trajectories import render_trajectories
from tracktable.render.render_heatmap import render_heatmap
from tracktable.render.backends import folium_backend
from tracktable.domain.terrestrial import BoundingBox
Instantiating a blank map
We include a tutorial helper function, generate_blank_folium_map(), to generate a blank Folium map as well as this create_map() wrapper for easily resetting and creating a Folium map. create_map() will be called throughout this tutorial to reset the map between examples. If the map is not reset then markers and dots for airports and ports will be continually added
to the map.
In [2]:
# Folium needs two corner points for bounding boxes: [sw, ne], in (lat,lon) order
# For most of this tutorial we will be setting the bounding box of the folium map to CONUS.
def create_map(bbox=[(22,-130),(50,-65)]):
return tutorial.generate_blank_folium_map(bbox=bbox,
tiles='cartodbdark_matter', attr=".", crs="EPSG3857",
control_scale=True,
max_zoom=22,
prefer_canvas=True)
Rendering Airports
Rendering airports on to a folium map is as simple as calling the render_airports_and_ports() function with the generated folium map from above as well as a list of ICAO/IATA codes of the airports which should be rendered, a bounding box in which to render all airports or both at the same time. Each marker/dot rendered onto the map has a tooltip and popup window which provides the following information about the given airport.
Name
City
Country
Lat, Lon, Alt (Feet & Meters)
IATA Code
ICAO Code
UTC Offset
Daylight Savings
By default, when rendering airports, if no airport list or bounding box is provided all airports in the database will be rendered onto the map.
Note: If the use_markers flag is set to True there will be a significant performance slowdown when viewing the map.
In [3]:
fol_map_canvas = create_map(bbox=None)
folium_backend.render_airports_and_ports(fol_map_canvas,
draw_airports=True
)
fol_map_canvas
Out[3]:
Next, we’ll provide a list of individual airports identified by their IATA codes to render onto the map.
In [4]:
fol_map_canvas = create_map()
folium_backend.render_airports_and_ports(fol_map_canvas,
draw_airports=True,
airport_list=["ABQ", "SFO", "SEA", "JFK"]
)
fol_map_canvas
Out[4]:
In order to better visualize the airports being rendered we can utilize markers when rendering the airports as well as change the color of the markers if desired.
Note: Using markers causing a significant performance decrease when rendering large amounts of airports. Ensure that prefer_canvas is set to True when creating the folium map or don’t use markers when rendering large quantities of airports.
In [5]:
fol_map_canvas = create_map()
folium_backend.render_airports_and_ports(fol_map_canvas,
draw_airports=True,
airport_list=["ABQ", "SFO", "SEA", "JFK"],
use_markers=True,
airport_color="green"
)
fol_map_canvas
WARNING:tracktable.render.backends.folium_backend:Using `markers` causes a considerable performance decrease, ensure `prefer_canvas=True` is set for the Folium map to help performance.
Out[5]:
Next, we will use a bounding box instead of a list of airports to render all of the airports located in Florida.
In [6]:
fol_map_canvas = create_map()
folium_backend.render_airports_and_ports(fol_map_canvas,
draw_airports=True,
airport_bounding_box=BoundingBox((-88, 24), (-79.5, 31)),
use_markers=True
)
fol_map_canvas
WARNING:tracktable.render.backends.folium_backend:Using `markers` causes a considerable performance decrease, ensure `prefer_canvas=True` is set for the Folium map to help performance.
Out[6]:
A list of airports and a bounding box can be provided at the same time to create more detailed visualizations.
In [7]:
fol_map_canvas = create_map()
folium_backend.render_airports_and_ports(fol_map_canvas,
draw_airports=True,
airport_list=["ABQ", "SFO", "SEA", "JFK"],
airport_bounding_box=BoundingBox((-88, 24), (-79.5, 31)),
use_markers=True
)
fol_map_canvas
WARNING:tracktable.render.backends.folium_backend:Using `markers` causes a considerable performance decrease, ensure `prefer_canvas=True` is set for the Folium map to help performance.
Out[7]:
If we don’t reset the map between calls to render_airport_and_ports() we are able to display various visualization combinations.
In [8]:
fol_map_canvas = create_map()
folium_backend.render_airports_and_ports(fol_map_canvas,
draw_airports=True,
airport_list=["ABQ", "SFO", "SEA", "JFK"],
use_markers=False,
airport_color="green"
)
folium_backend.render_airports_and_ports(fol_map_canvas,
draw_airports=True,
airport_bounding_box=BoundingBox((-88, 24), (-79.5, 31)),
use_markers=True
)
fol_map_canvas
WARNING:tracktable.render.backends.folium_backend:Using `markers` causes a considerable performance decrease, ensure `prefer_canvas=True` is set for the Folium map to help performance.
Out[8]:
Lastly, airports can be rendered directly from render_trajectories or render_heatmap when rendering trajectories or trajectory points onto a map to make it easier to see where the trajectories are going to and coming from or which airports are “hotter” then others.
In [9]:
trajectories = tutorial.get_trajectory_list('two-flights')
render_trajectories(trajectories,
draw_airports=True,
use_markers=True,
airport_bounding_box=BoundingBox((-82.6578, 26.7664), (-81.8075, 27.4872)),
prefer_canvas=True
)
Loading Trajectory Points And Assembling Points Into Trajectories: 0 trajectory [00:00, ? trajectory/s]INFO:tracktable.applications.assemble_trajectoriesAssembleTrajectoryFromPoints:New trajectories will be declared after a separation of None distance units between two points or a time lapse of at least 0:30:00 (hours, minutes, seconds).
INFO:tracktable.applications.assemble_trajectoriesAssembleTrajectoryFromPoints:Trajectories with fewer than 2 points will be discarded.
INFO:tracktable.applications.assemble_trajectoriesAssembleTrajectoryFromPoints:Done assembling trajectories. 2 trajectories produced and 0 discarded for having fewer than 2 points.
Loading Trajectory Points And Assembling Points Into Trajectories: 2 trajectory [00:00, 200.97 trajectory/s]
WARNING:tracktable.render.backends.folium_backend:Using `markers` causes a considerable performance decrease, ensure `prefer_canvas=True` is set for the Folium map to help performance.
[2025-06-09 01:18:51.920459] [0x00000001f1aadf00] [info] Done reading points. Generated 618 points correctly and discarded 1 due to parse errors.
Out[9]:
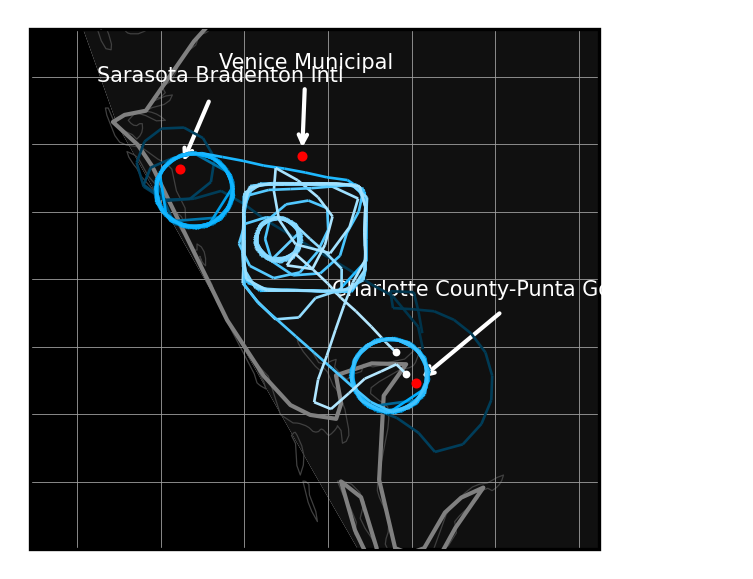
If a static image is prefered, the backend can be changed to generate a static map of the trajectories and airports.
In [10]:
trajectories = tutorial.get_trajectory_list('two-flights')
render_trajectories(trajectories,
backend='cartopy',
draw_airports=True,
airport_bounding_box=BoundingBox((-82.6578, 26.7664), (-81.8075, 27.4872)),
use_arrows=True,
draw_scale=False,
airport_label_size=5
)
Loading Trajectory Points And Assembling Points Into Trajectories: 0 trajectory [00:00, ? trajectory/s]INFO:tracktable.applications.assemble_trajectoriesAssembleTrajectoryFromPoints:New trajectories will be declared after a separation of None distance units between two points or a time lapse of at least 0:30:00 (hours, minutes, seconds).
INFO:tracktable.applications.assemble_trajectoriesAssembleTrajectoryFromPoints:Trajectories with fewer than 2 points will be discarded.
INFO:tracktable.applications.assemble_trajectoriesAssembleTrajectoryFromPoints:Done assembling trajectories. 2 trajectories produced and 0 discarded for having fewer than 2 points.
Loading Trajectory Points And Assembling Points Into Trajectories: 2 trajectory [00:00, 91.35 trajectory/s]
[2025-06-09 01:19:00.191350] [0x00000001f1aadf00] [info] Done reading points. Generated 618 points correctly and discarded 1 due to parse errors.
Out[10]:
<GeoAxes: >
In [11]:
trajectories = tutorial.get_trajectory_list('us-flights')
points = tutorial.trajectories_to_end_points(trajectories)
render_heatmap(points,
trajectories=trajectories,
draw_airports=True,
use_markers=False,
airport_bounding_box=BoundingBox((-130, 22), (-65, 50)),
prefer_canvas=True
)
Loading Trajectory Points And Assembling Points Into Trajectories: 0 trajectory [00:00, ? trajectory/s]INFO:tracktable.applications.assemble_trajectoriesAssembleTrajectoryFromPoints:New trajectories will be declared after a separation of None distance units between two points or a time lapse of at least 0:30:00 (hours, minutes, seconds).
INFO:tracktable.applications.assemble_trajectoriesAssembleTrajectoryFromPoints:Trajectories with fewer than 2 points will be discarded.
INFO:tracktable.applications.assemble_trajectoriesAssembleTrajectoryFromPoints:Done assembling trajectories. 29 trajectories produced and 0 discarded for having fewer than 2 points.
Loading Trajectory Points And Assembling Points Into Trajectories: 29 trajectory [00:00, 381.29 trajectory/s]
[2025-06-09 01:19:05.833353] [0x00000001f1aadf00] [info] Done reading points. Generated 6927 points correctly and discarded 22 due to parse errors.
Out[11]:
Rendering Ports
Much like the airport rendering above, rendering ports on to a folium map is as simple as calling the render_airports_and_ports() function with the a generated folium map. Each marker and dot rendered onto the map has a tooltip and popup window which provides the following information about the given port:
Name
Alternate Port Name
Lat, Lon
Region
Water Body
UN/LOCODE
World Port Index Number
The port database contains the following reference information that can be use used to pull port information:
A list of ports (These can be a port’s name, alternate name or World Port Index Number)
A bounding box
A country
A body of water
A World Port Index Region
By default, when rendering ports, if no specific port information is provided all ports will be rendered onto the map.
In [12]:
fol_map_canvas = create_map(bbox=None)
folium_backend.render_airports_and_ports(fol_map_canvas,
draw_ports=True)
fol_map_canvas
Out[12]:
Next, we’ll provide a list of individual ports identified by their names to render onto the map.
Note: If the use_markers flag is set to True there will be a significant performance slowdown when viewing the map.
In [13]:
fol_map_canvas = create_map(bbox=[(18.206889622398023, -129.375),(56.06484046010452, 2.4609375)])
folium_backend.render_airports_and_ports(fol_map_canvas,
draw_ports=True,
port_list=["newport", "Alexandria", "New Shoreham"])
fol_map_canvas
WARNING:tracktable.info.ports:`newport` matches 3 port names, provide a `country` along with a port name to narrow results or provide the port's World Port Index Number to retrieve the desired port.
INFO:tracktable.info.ports:`New Shoreham` is the alternate port name for `Shoreham Harbour`
Out[13]:
In the previous cell we rendered five ports onto the map, this is because the port newport corresponds to three ports in the world. To counteract this we will provide the country we are interested in, United States, to render_airports_and_ports().
In [14]:
fol_map_canvas = create_map(bbox=[(18.206889622398023, -129.375),(56.06484046010452, 2.4609375)])
folium_backend.render_airports_and_ports(fol_map_canvas,
draw_ports=True,
port_list=["newport", "Alexandria", "New Shoreham"],
port_country='United States')
fol_map_canvas
WARNING:tracktable.info.ports:`newport` matches 2 port names, provide a `country` along with a port name to narrow results or provide the port's World Port Index Number to retrieve the desired port.
INFO:tracktable.info.ports:`New Shoreham` is the alternate port name for `Shoreham Harbour`
WARNING:tracktable.info.ports:No ports found with the provided name `New Shoreham`. Double check the provided port information and/or remove the provided country.
Out[14]:
Now our map contains only three total ports but if we inspect which ports have been rendered we’ll see that we still have two newport ports. This is a common occurrence as there are many ports in the world. To better get all of the ports we are interested in we will use the World Port Index Number associated with each of the ports.
In [15]:
fol_map_canvas = create_map(bbox=[(18.206889622398023, -129.375),(56.06484046010452, 2.4609375)])
folium_backend.render_airports_and_ports(fol_map_canvas,
draw_ports=True,
port_list=[16820, "Alexandria", "New Shoreham"], # WPI numbers can be str or int
port_country='United States')
fol_map_canvas
INFO:tracktable.info.ports:`New Shoreham` is the alternate port name for `Shoreham Harbour`
WARNING:tracktable.info.ports:No ports found with the provided name `New Shoreham`. Double check the provided port information and/or remove the provided country.
Out[15]:
In the map above we see that we now only have two ports rendered. Newport in Oregon and Alexandria near Washington D.C., New Shoreham isn’t rendered because we restricted our port country to the United States.
In order to better visualize the ports being rendered we can utilize markers when rendering the ports as well as change the color of the markers if desired.
Note: Using markers causing a significant performance decrease when rendering large amounts of ports. Ensure that prefer_canvas is set to True when creating the folium map or don’t use markers when rendering large quantities of ports.
In [16]:
fol_map_canvas = create_map()
folium_backend.render_airports_and_ports(fol_map_canvas,
draw_ports=True,
use_markers=True,
port_list=[16820, "Alexandria", "New Shoreham"],
port_country='United States',
port_color="green")
fol_map_canvas
WARNING:tracktable.render.backends.folium_backend:Using `markers` causes a considerable performance decrease, ensure `prefer_canvas=True` is set for the Folium map to help performance.
INFO:tracktable.info.ports:`New Shoreham` is the alternate port name for `Shoreham Harbour`
WARNING:tracktable.info.ports:No ports found with the provided name `New Shoreham`. Double check the provided port information and/or remove the provided country.
Out[16]:
Next, we’ll render all of the ports located in the United States.
In [17]:
fol_map_canvas = create_map()
folium_backend.render_airports_and_ports(fol_map_canvas,
draw_ports=True,
use_markers=True,
port_country='United States')
fol_map_canvas
WARNING:tracktable.render.backends.folium_backend:Using `markers` causes a considerable performance decrease, ensure `prefer_canvas=True` is set for the Folium map to help performance.
Out[17]:
A list of ports and a specific country can be rendered independently of each other by setting the port_and_country_seperate flag to True.
In [18]:
fol_map_canvas = create_map()
folium_backend.render_airports_and_ports(fol_map_canvas,
draw_ports=True,
use_markers=True,
port_list=["Alexandria"],
port_country='Mexico',
port_and_country_seperate=True)
fol_map_canvas
WARNING:tracktable.render.backends.folium_backend:Using `markers` causes a considerable performance decrease, ensure `prefer_canvas=True` is set for the Folium map to help performance.
Out[18]:
Next, for brevity, we will generate a map with all of the port parameters that we listed above. These parameters can be utilized independently of each other.
In [19]:
fol_map_canvas = create_map(bbox=None)
folium_backend.render_airports_and_ports(fol_map_canvas,
draw_ports=True,
use_markers=True,
port_list=["63110", 63070, "Mar Del Plata", "Eva Peron"],
port_country="South Korea",
port_water_body="Baltic Sea",
port_wpi_region="Japan -- 61100",
port_bounding_box=BoundingBox((-88, 24), (-79.5, 31)), # Florida
port_and_country_seperate=True)
fol_map_canvas
WARNING:tracktable.render.backends.folium_backend:Using `markers` causes a considerable performance decrease, ensure `prefer_canvas=True` is set for the Folium map to help performance.
INFO:tracktable.info.ports:`Eva Peron` is the alternate port name for `La Plata`
Out[19]:
If we don’t reset the map between calls to render_airport_and_ports() we are able to display various visualization combinations.
In [20]:
fol_map_canvas = create_map(bbox=None)
folium_backend.render_airports_and_ports(fol_map_canvas,
draw_ports=True,
port_list=["63110", 63070, "Mar Del Plata", "Eva Peron"],
use_markers=False,
port_color="green")
folium_backend.render_airports_and_ports(fol_map_canvas,
draw_ports=True,
use_markers=True,
port_bounding_box=BoundingBox((-124, 45), (-116, 48)))
fol_map_canvas
INFO:tracktable.info.ports:`Eva Peron` is the alternate port name for `La Plata`
WARNING:tracktable.render.backends.folium_backend:Using `markers` causes a considerable performance decrease, ensure `prefer_canvas=True` is set for the Folium map to help performance.
Out[20]:
Lastly, ports can be rendered directly from render_trajectories or render_heatmap when rendering trajectories or trajectory points onto a map to make it easier to see where the trajectories are going to and coming from or which ports are “hotter” then others.
In [21]:
trajectories = tutorial.get_trajectory_list()
render_trajectories(trajectories,
draw_ports=True,
use_markers=True,
port_bounding_box=BoundingBox((-74.47357177734375, 40.212440718286466), (-73.41201782226562, 41.11246878918088)),
prefer_canvas=True
)
Loading Trajectories: 279 trajectory [00:00, 5303.37 trajectory/s]
WARNING:tracktable.render.backends.folium_backend:Using `markers` causes a considerable performance decrease, ensure `prefer_canvas=True` is set for the Folium map to help performance.
[2025-06-09 01:21:08.137309] [0x00000001f1aadf00] [info] Read a total of 279 trajectories.
Out[21]:
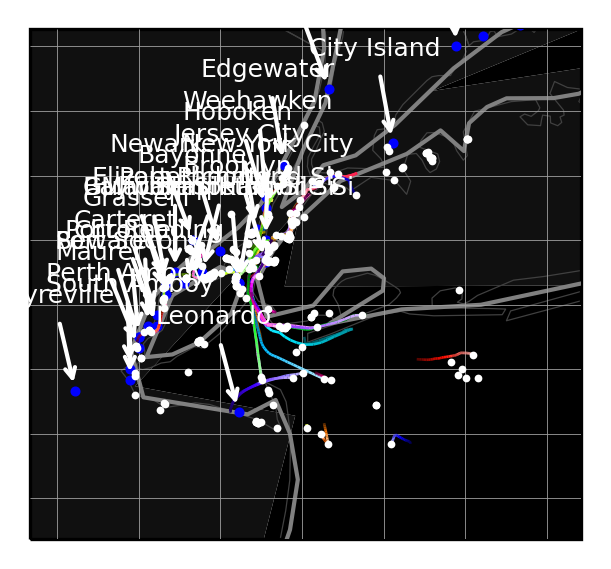
If a static image is prefered, the backend can be changed to generate a static map of the trajectories and ports.
In [22]:
trajectories = tutorial.get_trajectory_list()
render_trajectories(trajectories,
backend='cartopy',
draw_ports=True,
port_bounding_box=BoundingBox((-74.47357177734375, 40.212440718286466), (-73.41201782226562, 41.11246878918088)),
use_arrows=True,
draw_scale=False,
port_label_size=6,
draw_arrows=True
)
Loading Trajectories: 279 trajectory [00:00, 413.01 trajectory/s]
Out[22]:
<cartopy.mpl.geoaxes.GeoAxesSubplot at 0x7f9a2c597d30>
In [22]:
trajectories = tutorial.get_trajectory_list()
points = tutorial.trajectories_to_end_points(trajectories)
render_heatmap(points,
trajectories=trajectories,
draw_ports=True,
use_markers=True,
port_bounding_box=BoundingBox((-74.47357177734375, 40.212440718286466), (-73.41201782226562, 41.11246878918088)),
prefer_canvas=True
)
Loading Trajectories: 279 trajectory [00:00, 7214.35 trajectory/s]
WARNING:tracktable.render.backends.folium_backend:Using `markers` causes a considerable performance decrease, ensure `prefer_canvas=True` is set for the Folium map to help performance.
[2025-06-09 01:21:14.690697] [0x00000001f1aadf00] [info] Read a total of 279 trajectories.
Out[22]:
Rendering Airports and Ports Together
Airports and ports can be rendered together on the same map utilizing the features demonstrated above.
In [23]:
fol_map_canvas = create_map(bbox=None)
folium_backend.render_airports_and_ports(fol_map_canvas,
draw_ports=True,
draw_airports=True,
use_markers=True,
port_country="Australia",
port_water_body="Mediterranean Sea",
port_bounding_box=BoundingBox((-88, 24), (-79.5, 31)),
airport_list=["ABQ", "BOS", "SEA", "JFK"],
airport_bounding_box=BoundingBox((-124, 45), (-116, 48))
)
fol_map_canvas
WARNING:tracktable.render.backends.folium_backend:Using `markers` causes a considerable performance decrease, ensure `prefer_canvas=True` is set for the Folium map to help performance.
Out[23]:
In [ ]: